This week we’ve got a study on the age at which hockey players are at their peak (an important consideration when looking to sign a guy to a long-term contract), a look at what kind of conclusions you can draw from how a team does over various stretches of time, what it appears goalies are awarded three stars for, and a new stat based on plus-minus and Corsi.
![]()
NHL Points-per-Game Peak Age Estimation
http://www.behindthenethockey.com/2010/1/21/1261318/nhl-points-per-game-peak-age
I was meaning to do an age study using Goals Versus Threshold instead (and I still may, at some point), but PPG should be a pretty good proxy.
“For my sample, I looked at all NHL players born 1962-79 who played exclusively in the NHL, AHL or IHL from Age 21 to Age 29. I assumed that AHL and IHL points were worth 45% of an NHL point. The average points-per-game at each age came out as follows:
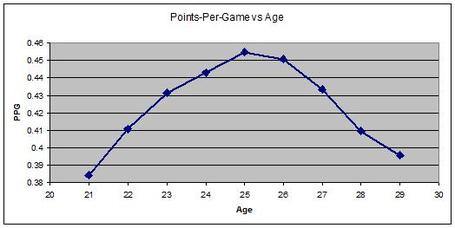
The peak age is just slightly more than 25. The peak age actually falls at approximately 25 for a wide range of NHL equivalencies for the minors. This is also roughly the same result as you get if you restrict your dataset solely to players with careers longer than 200 games and you look at the number of NHL games played at each age. Other methods don’t give substantially divergent results – even the most or least restrictive datasets result in peaks between age 24 and 26.”
Awesome.
Points. Predictions. Playoffstargalactica.
http://www.coppernblue.com/2010/1/25/1269445/points-predictions
“Looking at every season since the lockout gives us 120 completed seasons. In 36 of those seasons a team’s points percentage through 50 games predicted that same team’s points percentage over the last 32 games within a 5% range. So a team who won 60% of their points through the first 50 games would win between 55% and 65% of their points over the last 32 games about one third of the time. In the other 84 seasons a team’s point percentage changed by more than that +/- 5% range. About forty percent of the time (48 seasons) the change was greater than a range of +/- 10%. In other words, a team that earned 60% of their points through the first fifty games earned less than 50% or more than 70% through the last 32 games four times out of ten. That is a lot of variance…
So… what about the playoffs? I’m not sure what the conventional wisdom is right now. I think it’s fair to say that some folks believe being “hot” going into the playoffs is important and others think it makes no difference. The results from the last four years would seem to imply that a team’s performance in their last 32 games is more predictive than their performance through their first 50, despite the smaller sample of games. The following chart tells us how well standings points predicted the winner of a playoff series (a “tie” means the two teams had an equal points percentage):
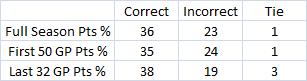
Maybe that’s all just variance and the full season stats will come out ahead in the end but I’m not all that confident. The “Full Season” results performed the best relative to the “Last 32″ in the 2005-06 playoffs when all three methods took a bit of a kicking. Right now 32 games looks pretty good but it’s probably not the ideal breaking point. I wonder where that “sweet spot” is.”
That would indeed be an interesting thing to find out.
Getting The Three Stars
http://www.puckprospectus.com/article.php?articleid=438
Since goalie valuation is still difficult to do using statistics – and valuation using ones’ eyes can be quite faulty over a long period of time – looking at single game subjective opinions using star selections might be handy.
“For all goalies with at least 25 games played in 2009-10, I tallied up the total number of three star selections and divided that by games played to get a Star Selection Percentage. Here is the correlation between that statistic and the other traditional goalie stats (all of which are expressed as a per-game rate for the most accurate comparison):
Correlation with Star Selection Percentage:
Winning Percentage:      0.31
Shutouts per Game:       0.32
Goals Against Average:  -0.53
Save Percentage:         0.76
The goalies that most often impressed the observers were not the ones who were most likely to be on the winning team or shut out the opposition. Instead, they were the goalies with the highest save percentages.”
Plus-Minus and Corsi have a Baby
http://www.puckprospectus.com/article.php?articleid=436
“The main factors that affect shot quality (distance, rebounds, game situation, game score) are well known. Simply weight each shot by its expected chance of resulting in a goal, do the difference of for and against as in Corsi, and voila! Delta, the love-child of Corsi and plus-minus, is born.”
Delta is then adjusted for a zone-neutral environment and for quality of competition.
Three Capitals showed up in the top 30 from last season:
"Player		    Pos Team	Delta	DeltaS	DeltaSO
ZACH PARISE	    L	njd	16.0	15.6	15.3
MARC-EDOUARD VLASIC D	san	15.3	14.6	14.5
COREY PERRY	    R	ana	14.1	13.2	14.0
PATRICK O'SULLIVAN  C	lak	14.2	13.5	13.6
MARC METHOT	    D	cls	14.2	13.8	13.6
JAROSLAV SPACEK	    D	buf	14.1	14.2	13.6
ERIC STAAL	    C	car	13.4	13.5	13.5
RYAN GETZLAF	    C	ana	13.3	12.4	13.3
MILAN MICHALEK	    L	san	14.5	13.3	13.2
JOE PAVELSKI	    C	san	13.7	13.3	13.1
RYAN SMYTH	    L	col	12.0	12.7	13.0
JOHAN FRANZEN	    C	det	12.1	12.2	12.8
ROB BLAKE	    D	san	13.4	12.6	12.3
ALEXANDER SEMIN	    L	was	14.3	13.2	12.2
JAMIE LANGENBRUNNER R	njd	12.7	12.4	12.1
ANDREW LADD	    L	chi	 9.1	10.8	11.8
RYANE CLOWE	    L	san	12.8	11.9	11.7
DAYMOND LANGKOW	    C	cgy	12.2	11.6	11.5
CHRIS KUNITZ	    L	ana	10.5	10.1	10.8
TRAVIS ZAJAC	    C	njd	11.3	11.1	10.8
BRIAN RAFALSKI	    D	det	10.6	 9.8	10.7
NICKLAS LIDSTROM    D	det	10.5	 9.7	10.6
JOE THORNTON	    C	san	12.3	10.6	10.6
MARTIN HAVLAT	    R	chi	10.0	 9.8	10.4
DAN BOYLE	    D	san	12.6	10.6	10.0
MIKE GREEN	    D	was	13.4	11.1	10.0
ANZE KOPITAR	    C	lak	 9.4	 9.3	 9.9
KYLE QUINCEY	    D	lak	10.9	 9.6	 9.9
MARIAN HOSSA	    R	det	10.1	 9.4	 9.7
ERIC FEHR	    R	was	10.7	 9.9	 9.3"
Something to keep an eye on going forward.